
In today’s data-driven world, marketing analytics plays a crucial role in understanding campaign effectiveness and driving business growth. Marketing Analytics 101: Metrics That Matter provides a comprehensive introduction to the key performance indicators (KPIs) that marketers need to track to optimize their strategies and achieve tangible results. This foundational guide covers essential metrics across various marketing channels, including digital marketing, social media marketing, and email marketing. Whether you are a seasoned marketer or just starting out, understanding these metrics is vital for making informed decisions and maximizing your return on investment (ROI).
This article delves into the “why” and “how” of marketing analytics, explaining the importance of data analysis in measuring campaign success and identifying areas for improvement. From website traffic and conversion rates to customer lifetime value (CLTV) and return on ad spend (ROAS), we will explore the metrics that truly matter. Learn how to leverage data to gain valuable insights into customer behavior, refine your targeting, and ultimately drive business growth. By mastering the fundamentals of marketing analytics, you can transform your marketing efforts from guesswork into a data-driven science.
What Is Marketing Analytics?
Marketing analytics is the practice of measuring, managing, and analyzing marketing performance to maximize its effectiveness and optimize return on investment (ROI). It involves collecting and analyzing data from various marketing channels, such as email, social media, search engines, and website traffic, to understand customer behavior, campaign performance, and overall marketing effectiveness. By using data-driven insights, businesses can make more informed decisions about their marketing strategies and tactics, ultimately driving growth and profitability.
Key areas where marketing analytics plays a crucial role include campaign optimization, customer segmentation and targeting, lead generation, and sales forecasting. Through the use of key performance indicators (KPIs) like conversion rates, click-through rates, and customer lifetime value, businesses can track progress towards their goals and identify areas for improvement. The ultimate objective of marketing analytics is to understand what is working, what isn’t, and how to improve future marketing efforts.
Different types of marketing analytics include descriptive analytics (understanding past performance), diagnostic analytics (investigating the reasons for past results), predictive analytics (forecasting future outcomes), and prescriptive analytics (recommending actions to optimize future results). By utilizing a combination of these analytical approaches, businesses can gain a comprehensive understanding of their marketing landscape and achieve a competitive advantage.
Why It’s Critical for Growth
Growth, whether personal or professional, hinges on continuous development and adaptation. Stagnation is the antithesis of growth, and actively pursuing opportunities for improvement is essential for reaching one’s full potential. This requires a willingness to embrace challenges, learn from mistakes, and consistently seek new knowledge and skills. Without this proactive approach, individuals and organizations risk falling behind and becoming irrelevant in a constantly evolving world.
The pursuit of growth fosters resilience. By continually challenging ourselves, we develop the ability to overcome obstacles and bounce back from setbacks. This resilience is not only crucial for navigating difficult times but also for capitalizing on opportunities that may arise unexpectedly. Growth also encourages innovation and creativity. By expanding our knowledge and skillset, we open ourselves up to new perspectives and approaches, leading to the development of novel solutions and ideas.
Ultimately, growth is intrinsically linked to success. Whether measured by personal fulfillment, professional achievement, or organizational progress, growth is the driving force behind positive outcomes. Embracing a growth mindset allows individuals and organizations to adapt to changing circumstances, overcome challenges, and achieve long-term sustainability and prosperity.
Setting Measurable KPIs
Key Performance Indicators (KPIs) must be quantifiable to effectively track progress and demonstrate impact. Measurable KPIs rely on specific metrics and targets, allowing for objective evaluation and analysis. For example, instead of a vague KPI like “improve customer satisfaction,” a measurable KPI would be “increase customer satisfaction scores by 10% within the next quarter,” as measured by customer surveys. This specificity enables businesses to accurately gauge performance and make data-driven decisions.
Establishing clear measurement methodologies is crucial. This involves identifying the appropriate data sources, defining calculation methods, and setting reporting frequencies. Whether you are tracking website traffic, sales conversions, or employee retention, the process for collecting and analyzing the data should be well-defined and consistently applied. This ensures the reliability and validity of your KPI data.
KPIs should also be aligned with overall business objectives. By connecting KPIs to strategic goals, organizations can ensure their efforts are focused on driving meaningful outcomes. This alignment ensures that every KPI contributes to the bigger picture and helps measure progress towards achieving strategic priorities. Regular review and adjustment of KPIs are essential to maintain relevance and effectiveness as business needs evolve.
Top Metrics to Track
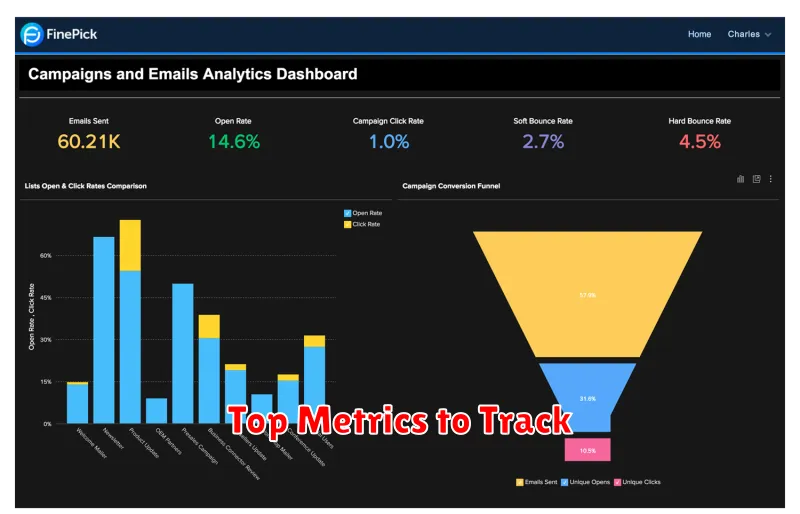
Tracking the right metrics is crucial for understanding business performance and making informed decisions. Key performance indicators (KPIs) provide quantifiable data that can reveal strengths, weaknesses, and opportunities for improvement. Focusing on the most relevant metrics allows businesses to allocate resources effectively and achieve strategic goals.
Some of the most important metrics to track often include revenue growth, customer acquisition cost (CAC), customer lifetime value (CLTV), and churn rate. For e-commerce businesses, conversion rate and average order value are also essential. Depending on the specific industry and business model, other relevant metrics might include market share, employee satisfaction, and return on investment (ROI).
By consistently monitoring these critical metrics, businesses can gain valuable insights into their operations and identify areas that require attention. Regular analysis of these KPIs enables data-driven decision making and allows businesses to adapt to changing market conditions and stay ahead of the competition.
Google Analytics 4 Basics
Google Analytics 4 (GA4) is the latest version of Google’s web analytics platform. It’s designed to provide a more comprehensive understanding of customer behavior across websites and apps, focusing on user engagement and event-based data rather than just page views. This allows businesses to gain deeper insights into the customer journey and make more informed decisions about marketing and product development.
Key features of GA4 include cross-platform tracking, enhanced measurement, and machine learning capabilities. Cross-platform tracking unifies web and app data, providing a holistic view of the customer experience. Enhanced measurement automatically collects data for certain events, reducing manual tagging. Machine learning fills data gaps and predicts future user behavior, offering valuable insights for businesses. These features help businesses adapt to a changing privacy landscape and gain a deeper understanding of their customers.
Migrating to GA4 is essential as Universal Analytics is being sunsetted. By setting up GA4 alongside your existing Universal Analytics property, you can ensure a smooth transition and begin collecting the data necessary to leverage the platform’s advanced capabilities. This proactive approach will provide you with the insights you need to succeed in the future of web analytics.
Attribution Models Explained
Attribution models are frameworks that determine how credit for conversions is assigned to different touchpoints in a customer’s journey. Understanding these models is crucial for marketers to optimize campaigns and allocate budget effectively. Different models distribute credit differently, and the “best” model depends on the specific business and its customer behavior. By analyzing how much each touchpoint contributes to a conversion, businesses can gain valuable insights into which marketing efforts are most impactful.
Several common attribution models exist. Single-touch models, like First Click and Last Click, assign all credit to a single interaction. Multi-touch models, such as Linear, Time Decay, and Position Based, distribute credit across multiple touchpoints. Data-driven attribution models leverage algorithms to dynamically assign credit based on observed data. Choosing the right model requires careful consideration of the customer journey and business objectives.
Selecting an appropriate attribution model can significantly impact how you interpret marketing performance. For example, a Last Click model might overemphasize the importance of bottom-of-the-funnel activities, while a Linear model could undervalue the initial touchpoints that introduced the customer to the brand. Proper attribution allows marketers to make more informed decisions, optimize campaigns, and ultimately drive better results.
Combining Data Sources
Combining data sources is crucial for gaining a comprehensive understanding and extracting valuable insights. By integrating data from various sources, you can enrich your analysis, identify trends, and make more informed decisions. Key considerations include data compatibility, cleaning, and transformation to ensure a seamless integration process.
Several methods exist for combining data, including joining, merging, and appending. Joining combines data based on a common field or key, allowing you to link related information from different tables. Merging involves combining datasets based on shared columns, often used when datasets have similar structures. Appending, on the other hand, adds rows from one dataset to another, useful for expanding a dataset with new data.
The benefits of combining data sources are numerous. It allows for a more holistic view of the information, unveils hidden relationships, and improves the accuracy of predictive models. Successful data combination leads to more robust and insightful analysis, empowering you to make better, data-driven decisions.
Real-Time Insights
Real-time insights provide businesses with up-to-the-minute information about various aspects of their operations. This immediate access to data allows for quick decision-making, improved responsiveness to market changes, and better operational efficiency. By analyzing data as it’s generated, businesses can identify trends, address issues proactively, and optimize performance in real time.
Key benefits of leveraging real-time insights include enhanced customer experiences, more effective marketing campaigns, and streamlined processes. For example, real-time data analysis can be used to personalize customer interactions, adjust pricing strategies dynamically, and detect fraudulent activities immediately. This leads to increased customer satisfaction, higher conversion rates, and reduced financial losses. The ability to act on fresh data grants a competitive advantage in today’s fast-paced market.
Implementing real-time insights typically involves integrating data from various sources, employing data processing tools capable of handling high-velocity streams of information, and visualizing the data in a user-friendly format. This can be achieved through specialized software platforms and dashboards that provide actionable intelligence to relevant stakeholders.
Visualizing Reports for Teams
Visualizing reports is crucial for effective team communication and decision-making. Converting raw data into charts, graphs, and other visual formats allows teams to quickly grasp key trends, identify potential issues, and understand complex information more easily. This leads to more efficient meetings and faster action on important insights.
Choosing the right visualization method depends on the type of data and the message you want to convey. For comparing categories, bar charts or pie charts are effective. Line charts are ideal for showing trends over time. When dealing with geographic data, maps are the most impactful choice. Using the correct visualization helps to ensure that the data is easily understood and supports effective communication within the team.
Several tools are available to create compelling visualizations, ranging from simple spreadsheet software to dedicated data visualization platforms. When presenting visual reports, focus on clarity and conciseness. Keep the visuals clean and uncluttered, use clear labels and titles, and highlight the key takeaways. Effective visual reports empower teams to make data-driven decisions and achieve their goals more efficiently.
Turning Data into Strategy
Data is the lifeblood of modern business. However, raw data alone offers little value. The true power lies in the ability to transform this data into actionable insights that drive strategic decision-making. This involves not just collecting data, but also analyzing it, interpreting its meaning, and then using those findings to inform and refine business strategy. This process, known as data-driven decision making, allows organizations to identify opportunities, mitigate risks, and ultimately achieve their goals more effectively.
Turning data into strategy involves several key steps. First, businesses must identify the right data to collect – data that aligns with their specific business objectives. Next, they need to implement effective data analysis techniques to uncover meaningful patterns and trends. Finally, these insights need to be translated into concrete actions, integrated into the overall business strategy, and continuously monitored and adjusted based on performance and ongoing data analysis.
The benefits of data-driven strategy are numerous. Organizations can optimize their operations, improve customer experiences, develop innovative products and services, and gain a competitive edge in the marketplace. By embracing a culture of data-driven decision making, businesses can unlock their full potential and thrive in today’s dynamic environment.